


Tyler Durden, you let me down
Let's talk about that Zero Hedge chart...


“On a long enough timeline, the survival rate for everyone drops to zero.”
Maybe it was the anarchic nom de plume, “Tyler Durden,” that drew me in — after all, cult-classic Fight Club is a top-five all-time flick in my book, and I’ve always been a sucker for a good pseudonym.1 Or maybe it was the site’s name: “Zero Hedge,” a nod to the concept I’d first encountered in my undergraduate finance coursework on options and derivatives. Whatever the reason, I eagerly showed up to the Zero Hedge party — and stayed for the contrarian-style, hardcore market analysis, the anti-establishment tone, and the Austrian School of Economics slant. But in the "nothing good happens after 3 a.m." sense, it’s time for an Irish goodbye.
For the uninitiated, Zero Hedge has a storied history of stirring up dissent, often dismissed, censored, or outright suppressed by financial media "gatekeepers" and Big Tech.2 (I have strong opinions about this which I’ll table for brevity’s sake.) My introduction came circa 2013/2014 as an undergrad, double-majoring in Economics and Finance. Hell-bent on understanding the inner workings of global financial markets, I was instantly hooked.
Here’s how it happened:
*scrolling Twitter at frat house*
“Uh, why the fuck is my favorite economist Mohamed El-Erian retweeting an account with a picture of a half-naked dud- wait, that’s Tyler Durden?!”
*navigates to @zerohedge Twitter profile*
“Dark pools? High-frequency trading algorithms? Bid-rigging market makers? QE-driven faux-liquidity? Shitting on Janet Yellen? Yes, Tyler Durden, talk dirty to me.”
All of it was music to my eager and open ears. And regardless of who the pseudonymous administrators behind the veil of a cig-ripping 1999 Brad Pitt avatar were, one thing was for certain: they knew their shit. More than that, ZH was hell-bent on shining a bright light on the financial world’s shadowy corners — they even have a manifesto:
The manifesto concludes with a reference to the 1995 opinion by U.S. Supreme Court Justice Stevens, writing for the majority in McIntyre v. Ohio Elections Commission (514 U.S. 334), which affirmed the constitutional right to anonymous dissident speech.
For years, Zero Hedge was my go-to for cutting-edge analysis, contrarian macroeconomic takes, and hard truths about markets. Even after graduating and well into my career working in financial markets, the site remained an invaluable resource. It wasn’t long before its popularity exploded among finance professionals, making the doxing of its author(s) inevitable.
That moment arrived in 2016, when Bloomberg ran a piece titled Unmasking the Men Behind Zero Hedge, Wall Street's Renegade Blog. The doxing felt like the end of an era. Sure, curiosity about the authors was natural, but the anonymity was part of the mystique. In a follow-up to the veil-lifting Bloomberg piece,
aptly described Zero Hedge:"Zero Hedge has become known as a source of cutting-edge news, rumors and gossip about the financial industry, as well as a haven for gold bugs, foes of the Federal Reserve and critics of high-frequency trading," …
"But I've realized that the website is also something else—a kind of support group for financial industry workers who are worried about their own economic future in the face of sweeping changes in technology, regulation and demand."
I’d generally concur with Noah’s characterization. As a reader, I approached Zero Hedge with healthy skepticism but never dismissed it outright. The publication illuminated critical issues, including securities price manipulation through high-frequency trading and dark pools, the Fed’s questionable quantitative easing experiments, and China’s dubious economic data.
Over the years, I kept tabs on Zero Hedge from afar. By the late 2010s and into the 2020s, the site’s right-wing, “permabear” bias became readily apparent and frankly exhausting given its persistent contrarianism in the face of a near-decade bull market rally. And by 2024, as it turns out, Zero Hedge had fully shifted to outright deception.
I’ll admit I was initially duped by the infamous Zero Hedge chart posted mere hours after most news outlets called the presidential race. It was one of the first tweets I saw the morning after the election, and my knee-jerk reaction was precisely what the purveyors of this viral chart sought to evoke: that the 2020 election was an anomaly if not outright “stolen.” Then I took a closer look and became overwhelmed with disgust. Curious, I checked the replies on X and to my chagrin, saw no one objecting to this chart’s grotesque misrepresentation of data.
The chart from the original tweet on the morning of November 6 has since garnered over 20 million views on Twitter X:

Aside from the unnecessary annotations (just let the data speak for itself), this chart's misleadingness is rooted in the truncation of its y-axis at 50 million. Cutting off the y-axis scale doesn’t render the graphed data inaccurate, per se, but it distorts the visualization, accentuating more minute discrepancies. The deception was deliberate, as no charting software (that I’m aware of) would change the y-axis scale from zero on its own. Worse, it worked — the tweet fanned flames already burning across a polarized electorate, offering up conspiracy fodder to millions ripe to indulge in it.
Here’s how the chart should have been displayed (with the area omitted by Zero Hedge shaded):

Worse yet, the chart was posted less than 12 hours after the vote count began, which meant that it compared incomplete 2024 data to complete data from prior elections. California, the most populous and one of the bluest states, hadn’t even yet begun counting votes when Zero Hedge posted their chart. They knew this, or should have—and it’s unacceptable.
The estimated final popular vote count count is far from anomalous, and looks something like this:
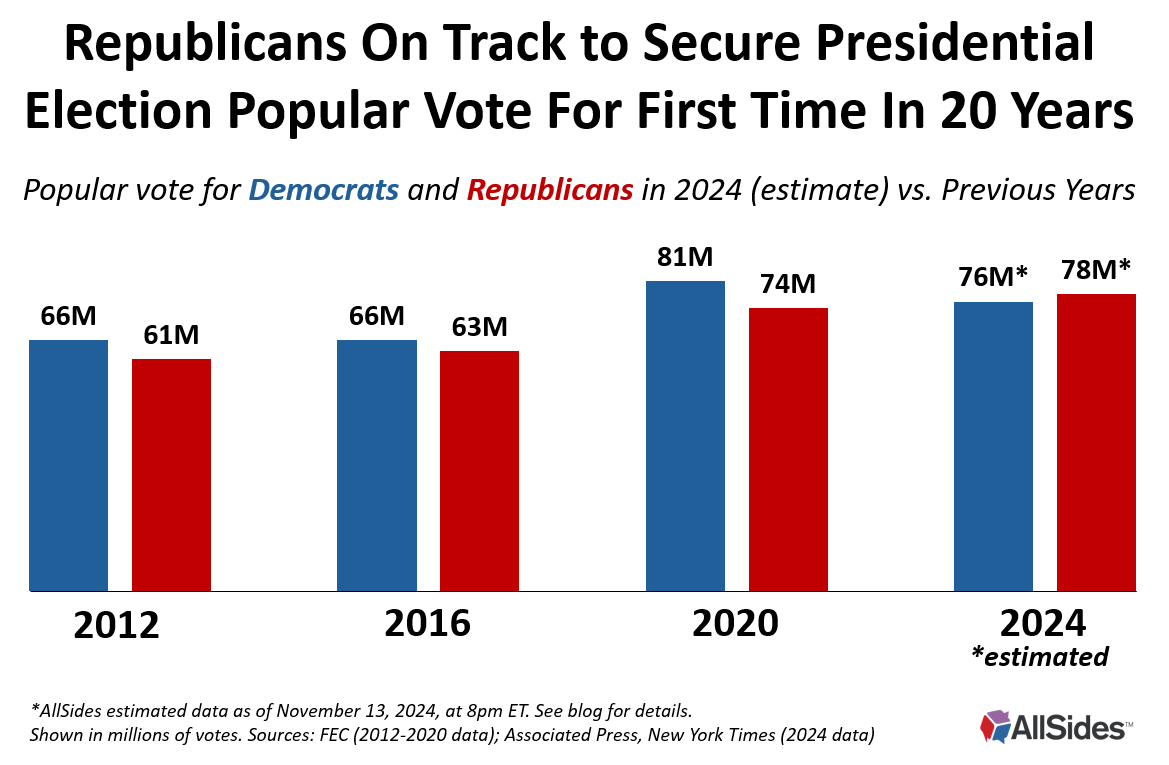
This reflects a near identical overall electoral turnout in 2024 versus 2020. The Zero Hedge chart was embarrassing and/or unacceptable for at least one of two reasons — they either 1) didn’t know that some 20% of votes were yet to be counted, or 2) were attempting generate buzz (and clicks) by distorting the truth.
So, to Zero Hedge, I’d say this: I believed in your cause, your ethos. But you let me down. Your misleading chart wasn’t just dubious; it was a betrayal of the principles you claim to uphold. Truth discernment requires integrity, and the grain of salt once needed to consume your work has grown unpalatably large.
The knowledge and insight I gained from Zero Hedge in its heyday was invaluable. But to quote Tyler Durden, “On a long enough timeline, the survival rate for everyone drops to zero.” And not unlike the Irish goodbye, it’s time for my overdue departure.
Shout-out
By Facebook, legacy Twitter, and even Google
Hey! I love me some ZH. But I think if you want to venture there then you have to be prepared to filter out the nutty stuff. Of course, that's true of everything.
I agree that it is bad practice to not start graphs at 0, and I agree that the ZH graph did indeed distort the magnitude of the effect. I also applaud you for your firm commitment to statistical communication best practices. However, to be fair a LOT of people commit this sin, and some will even be willing to explicitly justify the practice, precisely because it exaggerates the effect. In that case, it's not fair to pick on poor little ZH.
Even though the ZH graph distorts the actual effect, it's nonetheless true that there really was a remarkable increase in the number of voters in 2020, and it's not statistically consistent with the variation observed between the turnouts for the other elections.
Amazed that ZH would be so obviously deceptive. Tinkering with y-axis scaling is one of the oldest and widely used tricks. Darrell Huff complained about it in 1954 ("How to Lie with Statistics"), and you can still see it everywhere (Fox seems especially enamored).